Supplementary Information (BEST VIEWED WITH
NETSCAPE)
Comparisons and validation of
statistical clustering techniques for microarray gene
expression data
Susmita Datta and Somnath Datta
Bioinformatics 19, 2003
Simulated data sets:
Expression profiles for
all the genes in the simulated datasets and
the
nine model temporal profiles
The average proportion of
non-overlap measure for various clustering algorithms
applied
to the simulated data
Average temporal profiles
of nine groups obtained using various
clustering
algorithmsfor the simulated datasets
Sporulation Data: The results of the grouping are
graphically represented below. Here the points represent the first two
principal components of the actual data (for the positively expressed genes).
The points are color-coded and labeled by their group membership which is local
to each plot (since a group label under one clustering algorithm does not
correspond to a group label under another algorithm). These graphs should only
be compared visually to one another.
Clustering of all positively expressed
genes during sporulation
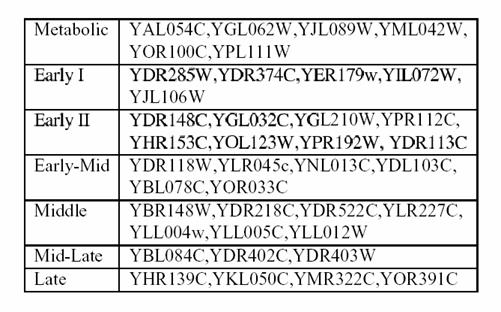
Hand-picked genes (ORF) in various
temporal groups
Expression profiles of all positively
expressed genes.
The clusters are obtained using Diana
S-Plus code used in the paper to compute the validation measures for the Sporulation data Download
since