Supplementary
website for
“Reconstruction of
genetic association networks from microarray data:
A partial least squares
approach”
Vasyl Pihur, Somnath Datta, Susmita
Datta*
*e-mail:
susmita.datta_AT_louisville.edu
Abstract
Motivation: Gene association networks provide vast amounts of information
about essential processes inside the cell. A complete picture of gene-gene
interactions would open new horizons for biologists, ranging from pure
appreciation to successful manipulation of biological pathways for therapeutic
purposes. Therefore, identification of important biological complexes whose
members (genes and their products proteins) interact with each other is of
prime importance. Numerous experimental methods exist but, for the most part,
they are costly and labor-intensive. Computational techniques, such as the one
proposed in this work, provide a quick “budget” solution that can be used as a
screening tool before more expensive techniques are attempted. Here, we
introduce a novel computational method based on the Partial Least Squares (PLS)
regression technique for reconstruction of genetic networks from microarray data.
Results: The proposed PLS
based method is shown to be an effective screening procedure for the detection
of gene-gene interactions from microarray data. Both
simulated and real microarray experiments show that
the PLS based approach is superior to its competitors both in terms of
performance and applicability.
_________________________________________________________
Download
R-Code (distributed as is without warrantee;
needs the base distribution of R and the R package locfdr from
http://www.r-project.org/)
Additional Results for the Simulated Data
Additional Results for the Real Data
Distribution function of the overall scores for two groups
_________________________________________________________
Effect of
the number of PLS components on the performance of the genetic network
procedure
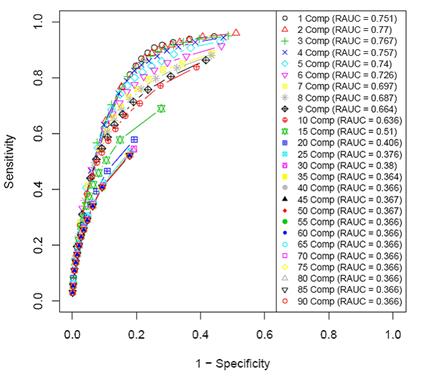
|
# of components
|
The average number of discovered
interactions for the simulated data (over 10 datasets). The larger
the number of PLS components, the smaller the number of discovered
interactions. At about 30 components, convergence for each level of fdr (false discovery rate) is observed.
_________________________________________________________
Performance of Scores based on
estimated PLS coefficients
(see the last but
one paragraph of Section 2 in the paper)
1.
The locfdr procedure may break down if
one uses the estimated PLS coefficients as measures of association/interaction
(not recommended). This table shows the number of such breakdowns with 100
simulated data sets.
|
# of Components |
|
3 |
4 |
5 |
6 |
7 |
8 |
10 |
15 |
|
# of datasets
for which locfdr breaks down |
|
77 |
77 |
70 |
50 |
39 |
35 |
24 |
14 |
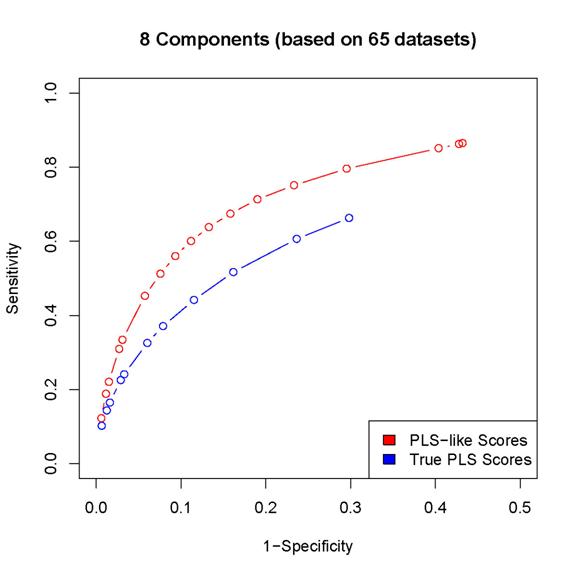
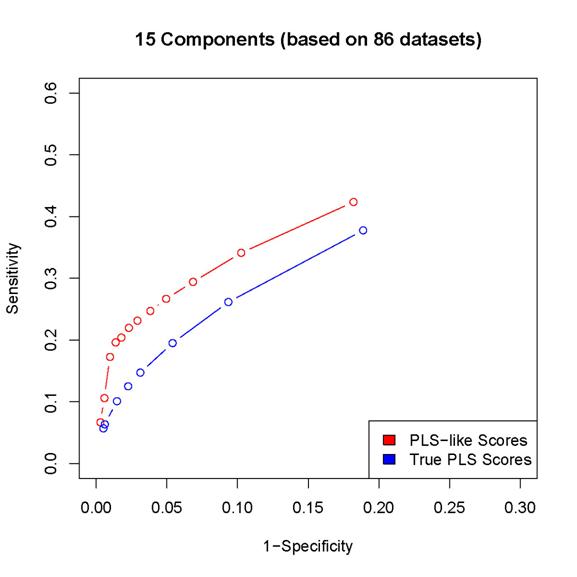
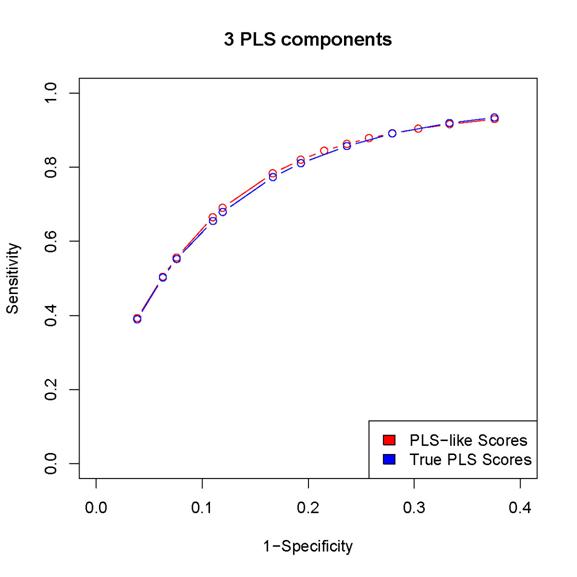
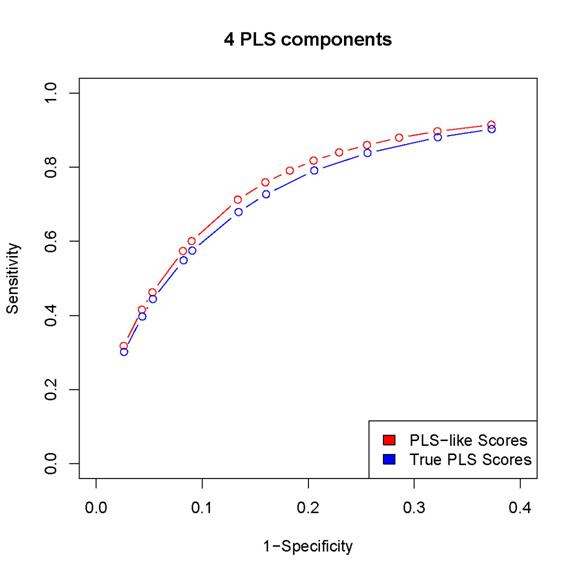
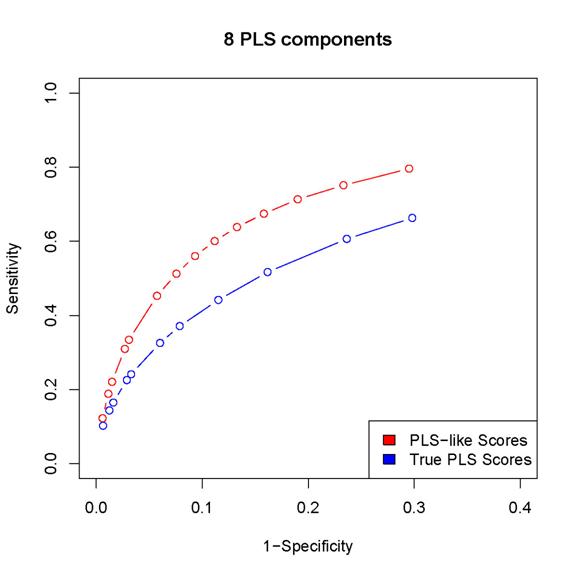
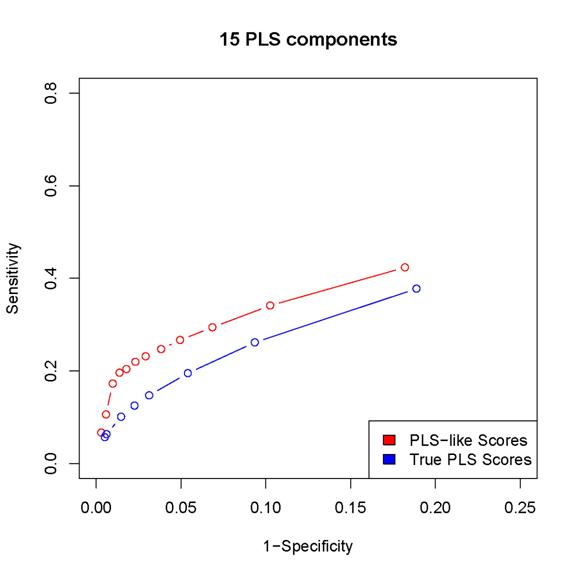
2. The scores proposed in the paper results in better
sensitivity/specificity than the corresponding procedure based on
estimated PLS coefficients (as in the last but one
paragraph of Section 2 in the paper).
Since
the locfdr procedure may break down while using the PLS coefficients,
we can either calculated sensitivity/specificity only for those simulated data sets
for which the locfdr
control works or set the thresholds so that the same number of "interactions" are
discovered by the two procedures (note that the locfdr control works with the scores introduced in
the paper). In either case, the estimated PLS coefficients lead to worse
performance than the scores introduced in the paper.
Here
are some examples:
(In
these plots, the term "PLS-like Scores" is used to indicate network
discovery procedure using the scores introduced in the paper and the term "True
PLS scores" is used to indicate the network discovery procedure using the estimated
PLS coefficients)
|
|
|
|
|
|
|
|
|
3. The scores proposed in the paper results in better
performance than the corresponding procedure based on
estimated PLS coefficients even for the real data set
as shown by the following table:
|
Fdr level |
Discovered |
PLS-like Scores True Positive |
PLS Scores True Positive |
|
0.01 |
29 |
4 |
0 |
|
0.1 |
118 |
17 |
1 |
|
0.13 |
160 |
17 |
1 |
|
0.16 |
210 |
19 |
1 |
|
0.2 |
272 |
22 |
15 |